In this article you are going to learn how to monitor Caddy by collecting metrics with Prometheus.
You are going to use docker compose to spin up all the required services.
Caddyfile #
Let's start with a basic Caddyfile.
:80 { handle / { respond "Hello World" } }Caddyfile
Write a docker-compose.yaml file to run the above Caddyfile.
version: '3.8' services: caddy: image: caddy:latest ports: - 8080:80 - 2019:2019 volumes: - ./Caddyfile:/etc/caddy/Caddyfiledocker-compose.yaml
Now bring up the services using.
docker compose up
The above will run caddy and make it available it on localhost:8080.
Make sure to expose the port
2019as well, this is the admin api for Caddy which will be used to collect metrics.
Enabling metrics #
Use the caddy's global options to enable prometheus metrics.
{ servers { metrics } admin :2019 } :80 { handle / { respond "Hello World" } }Caddyfile
The above additional options enables prometheus's metrics endpoint in Caddy.
Re-run the services using docker compose up and visit localhost:2019/metrics, you should see the metrics.
$ curl -X GET localhost:2019/metrics

# TYPE caddy_admin_http_requests_total counter
caddy_admin_http_requests_total{code="200",handler="metrics",method="GET",path="/metrics"} 1
# HELP go_build_info Build information about the main Go module.
# TYPE go_build_info gauge
go_build_info{checksum="",path="",version=""} 1
# HELP go_gc_duration_seconds A summary of the pause duration of garbage collection cycles.
# TYPE go_gc_duration_seconds summary
go_gc_duration_seconds{quantile="0"} 3.3406e-05
go_gc_duration_seconds{quantile="0.25"} 4.1655e-05
go_gc_duration_seconds{quantile="0.5"} 5.0581e-05
go_gc_duration_seconds{quantile="0.75"} 0.000366327
go_gc_duration_seconds{quantile="1"} 0.000366327
go_gc_duration_seconds_sum 0.000491969
go_gc_duration_seconds_count 4
# HELP go_goroutines Number of goroutines that currently exist.
# TYPE go_goroutines gauge
go_goroutines 16
# HELP go_info Information about the Go environment.
# TYPE go_info gauge
go_info{version="go1.20"} 1
# HELP go_memstats_alloc_bytes Number of bytes allocated and still in use.

... more metrics
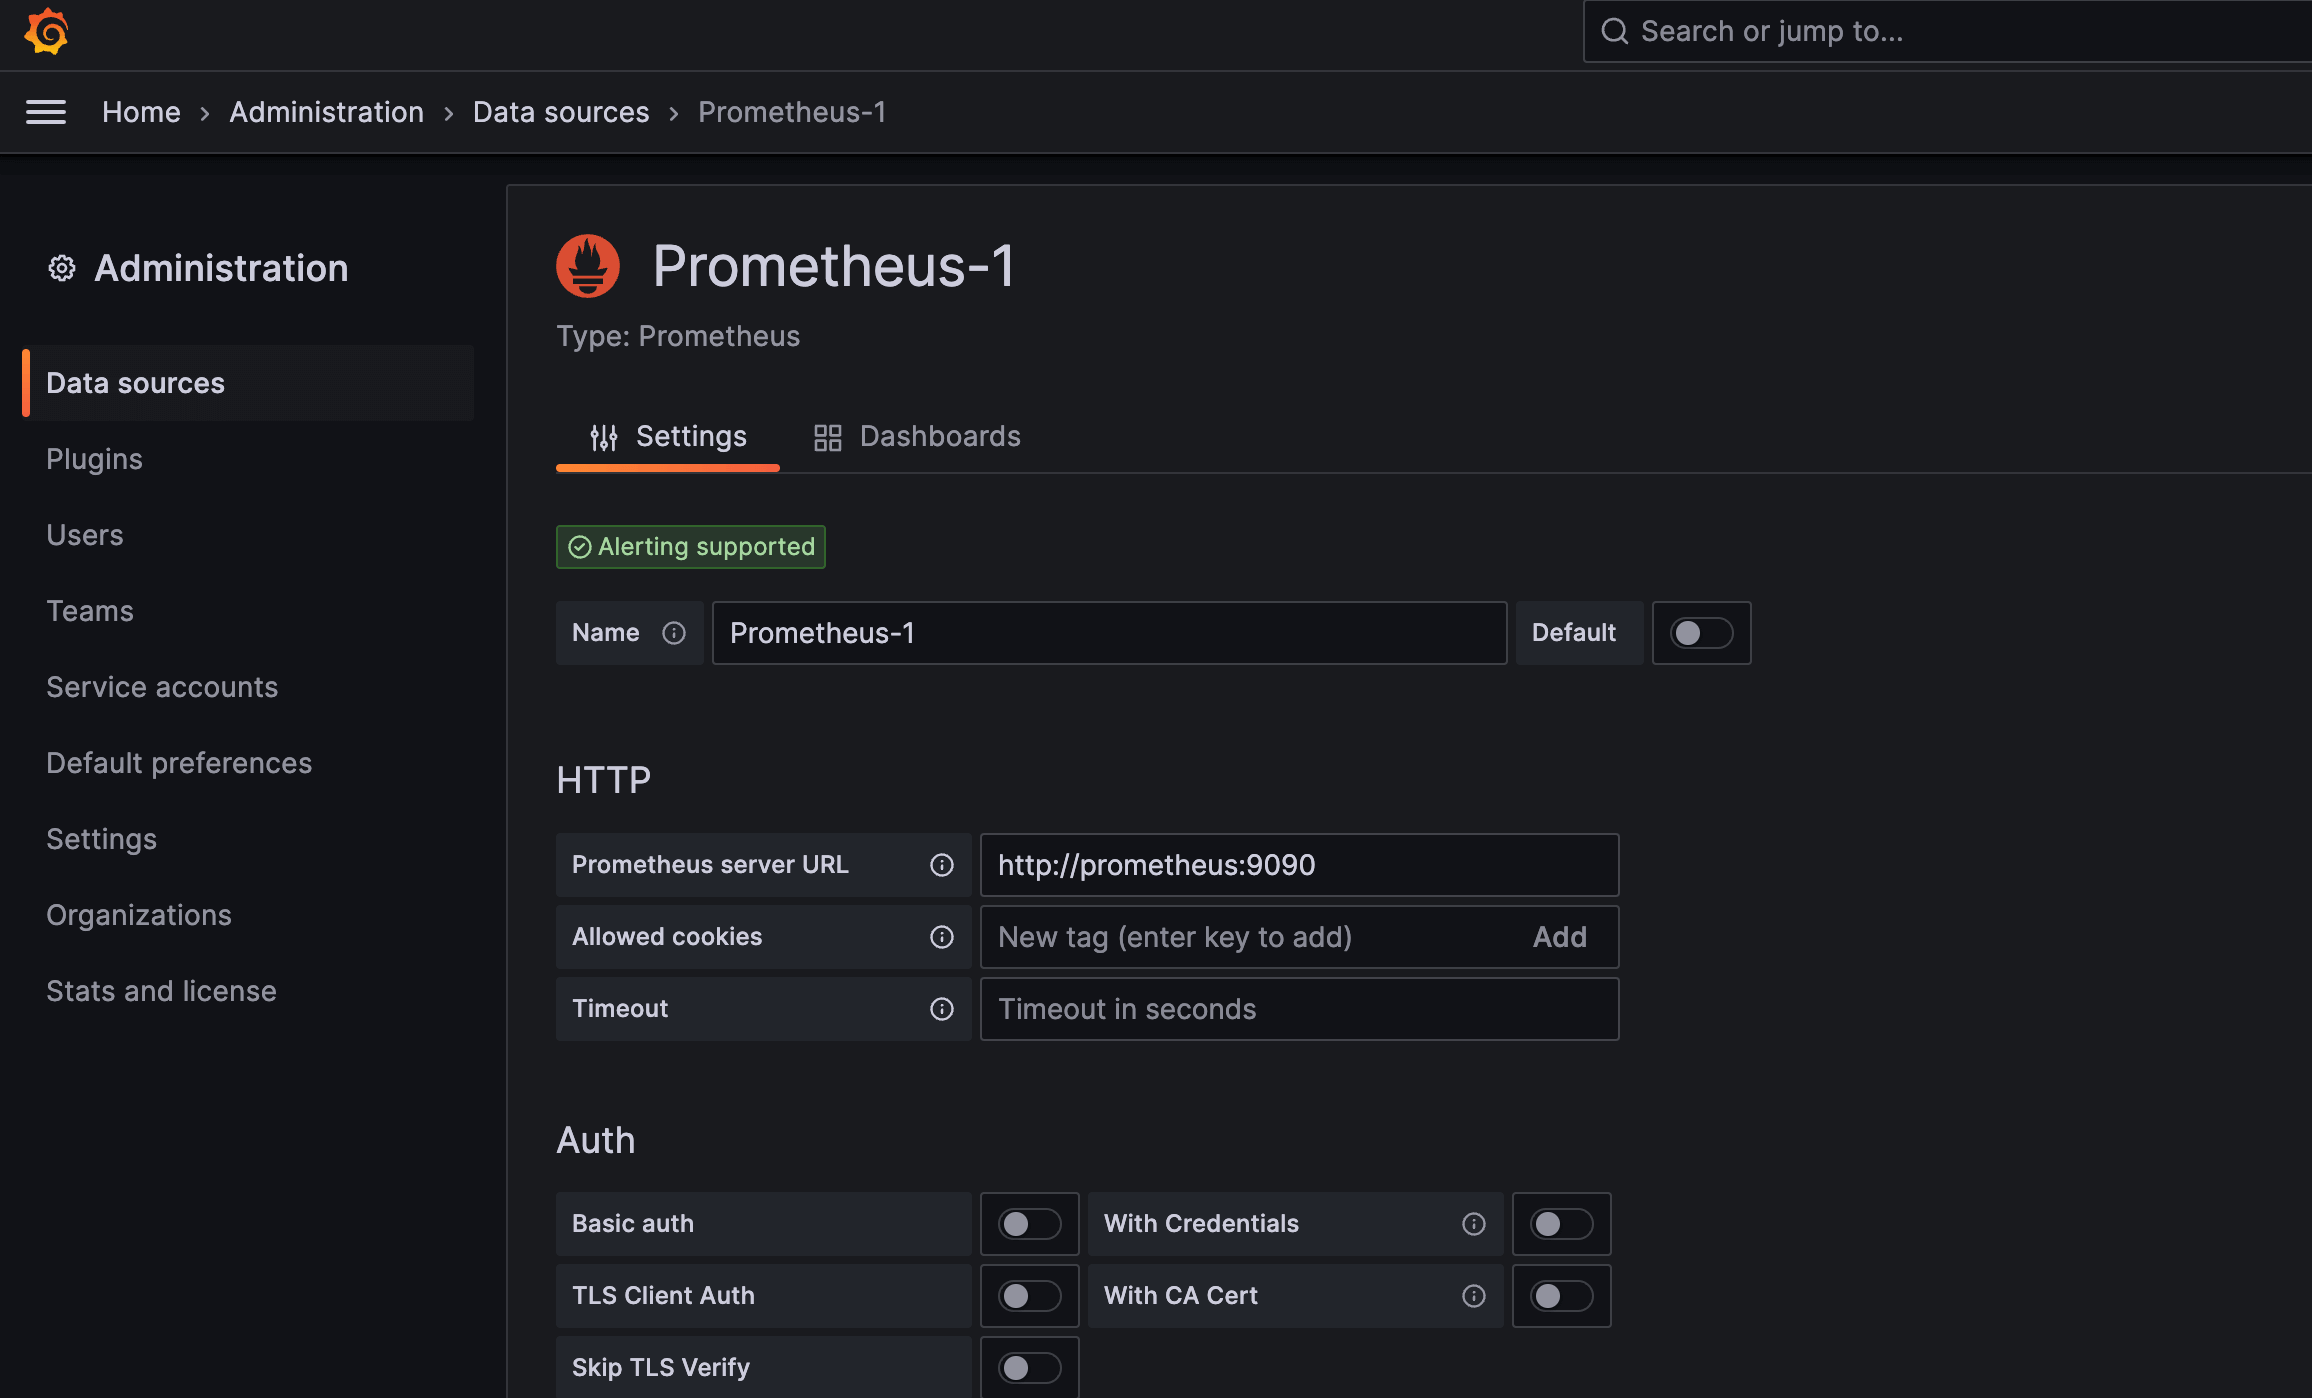
Setting up Prometheus #
Create the prometheus config.
global: scrape_interval: 5s scrape_configs: - job_name: caddy static_configs: - targets: ['caddy:2019']prometheus.yaml
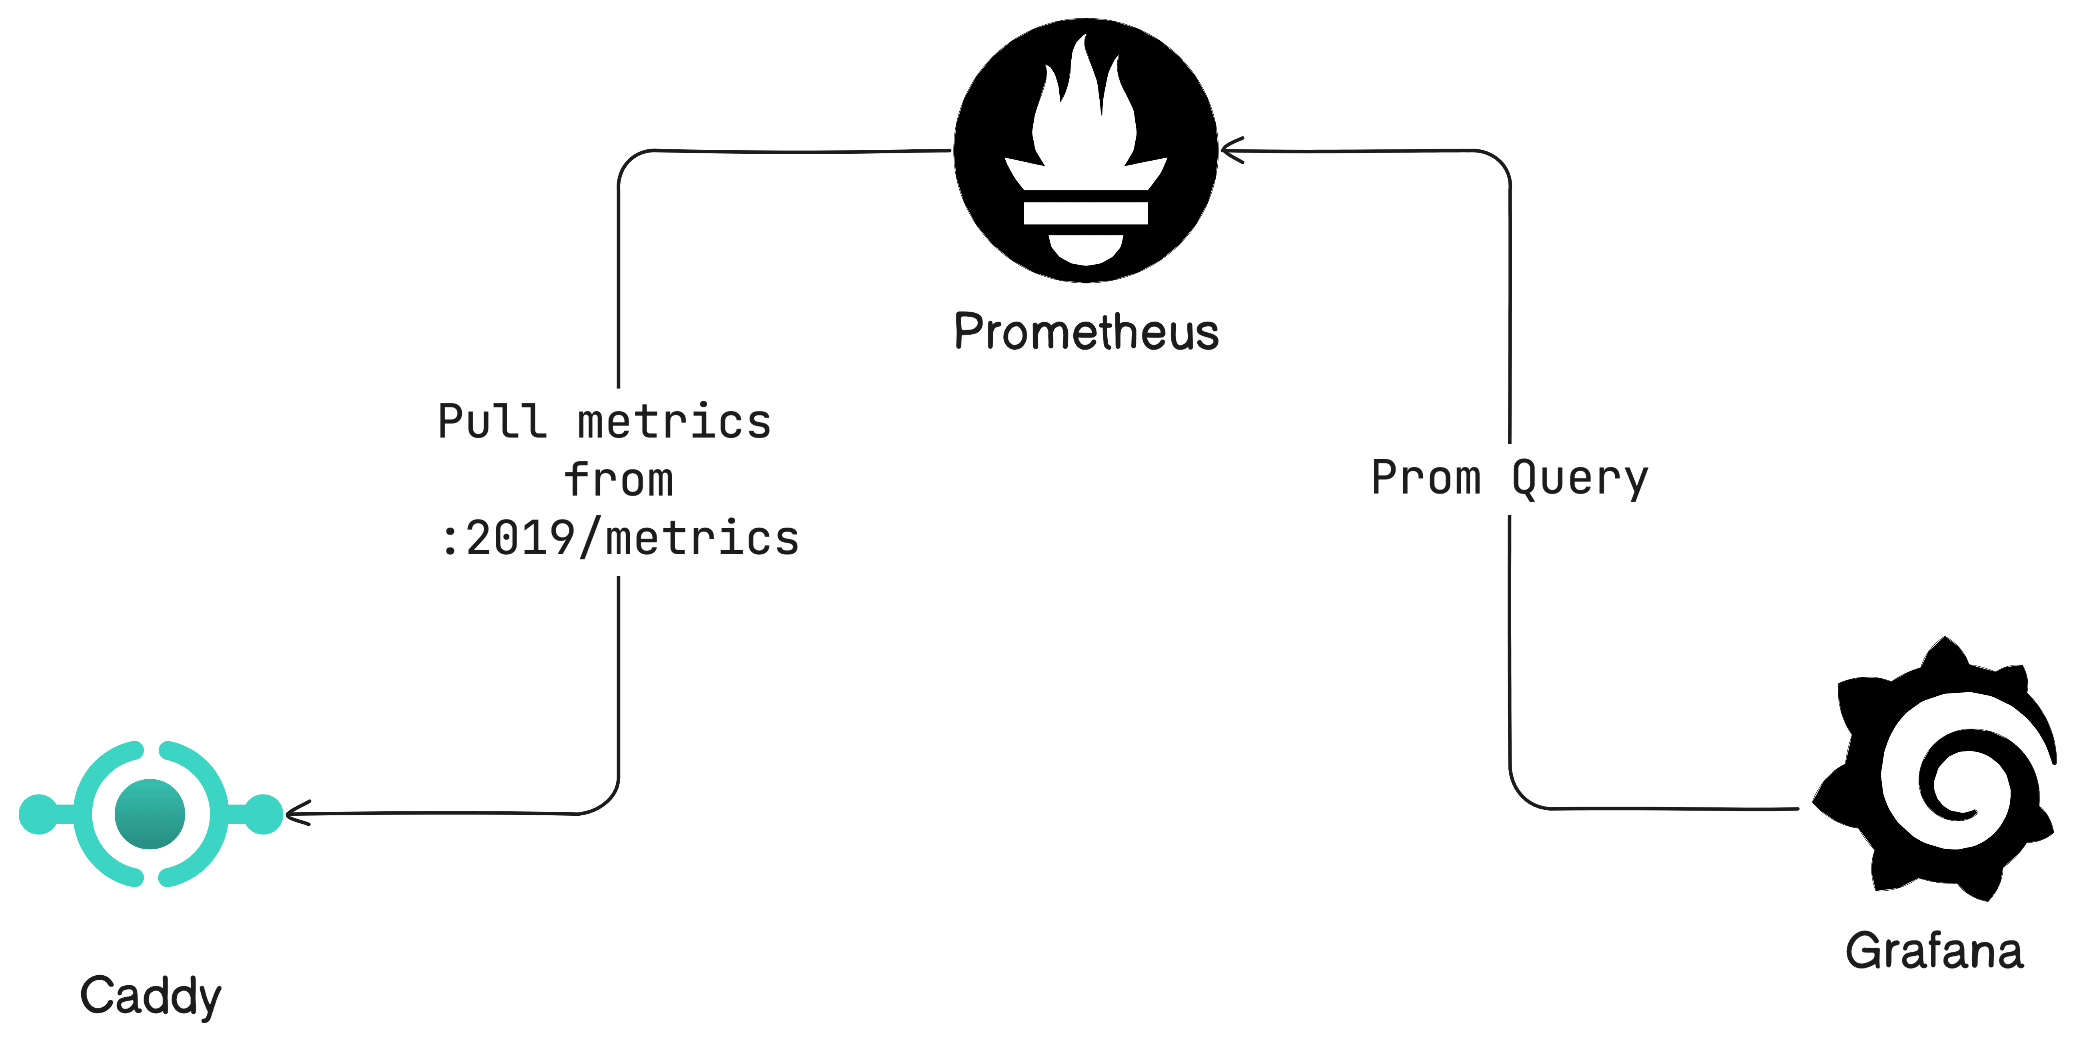
The above adds a new scrape config with urlcaddy:2019 (because in docker compose other services are reachable by name).
Add prometheus service in the docker-compose.yaml file.
version: '3.8' services: caddy: image: caddy:latest ports: - 8080:80 - 2019:2019 volumes: - ./Caddyfile:/etc/caddy/Caddyfile prometheus: image: prom/prometheus:latest ports: - 9090:9090 volumes: - ./prometheus.yml:/etc/prometheus/prometheus.ymldocker-compose.yaml
Re-run using docker compose up.
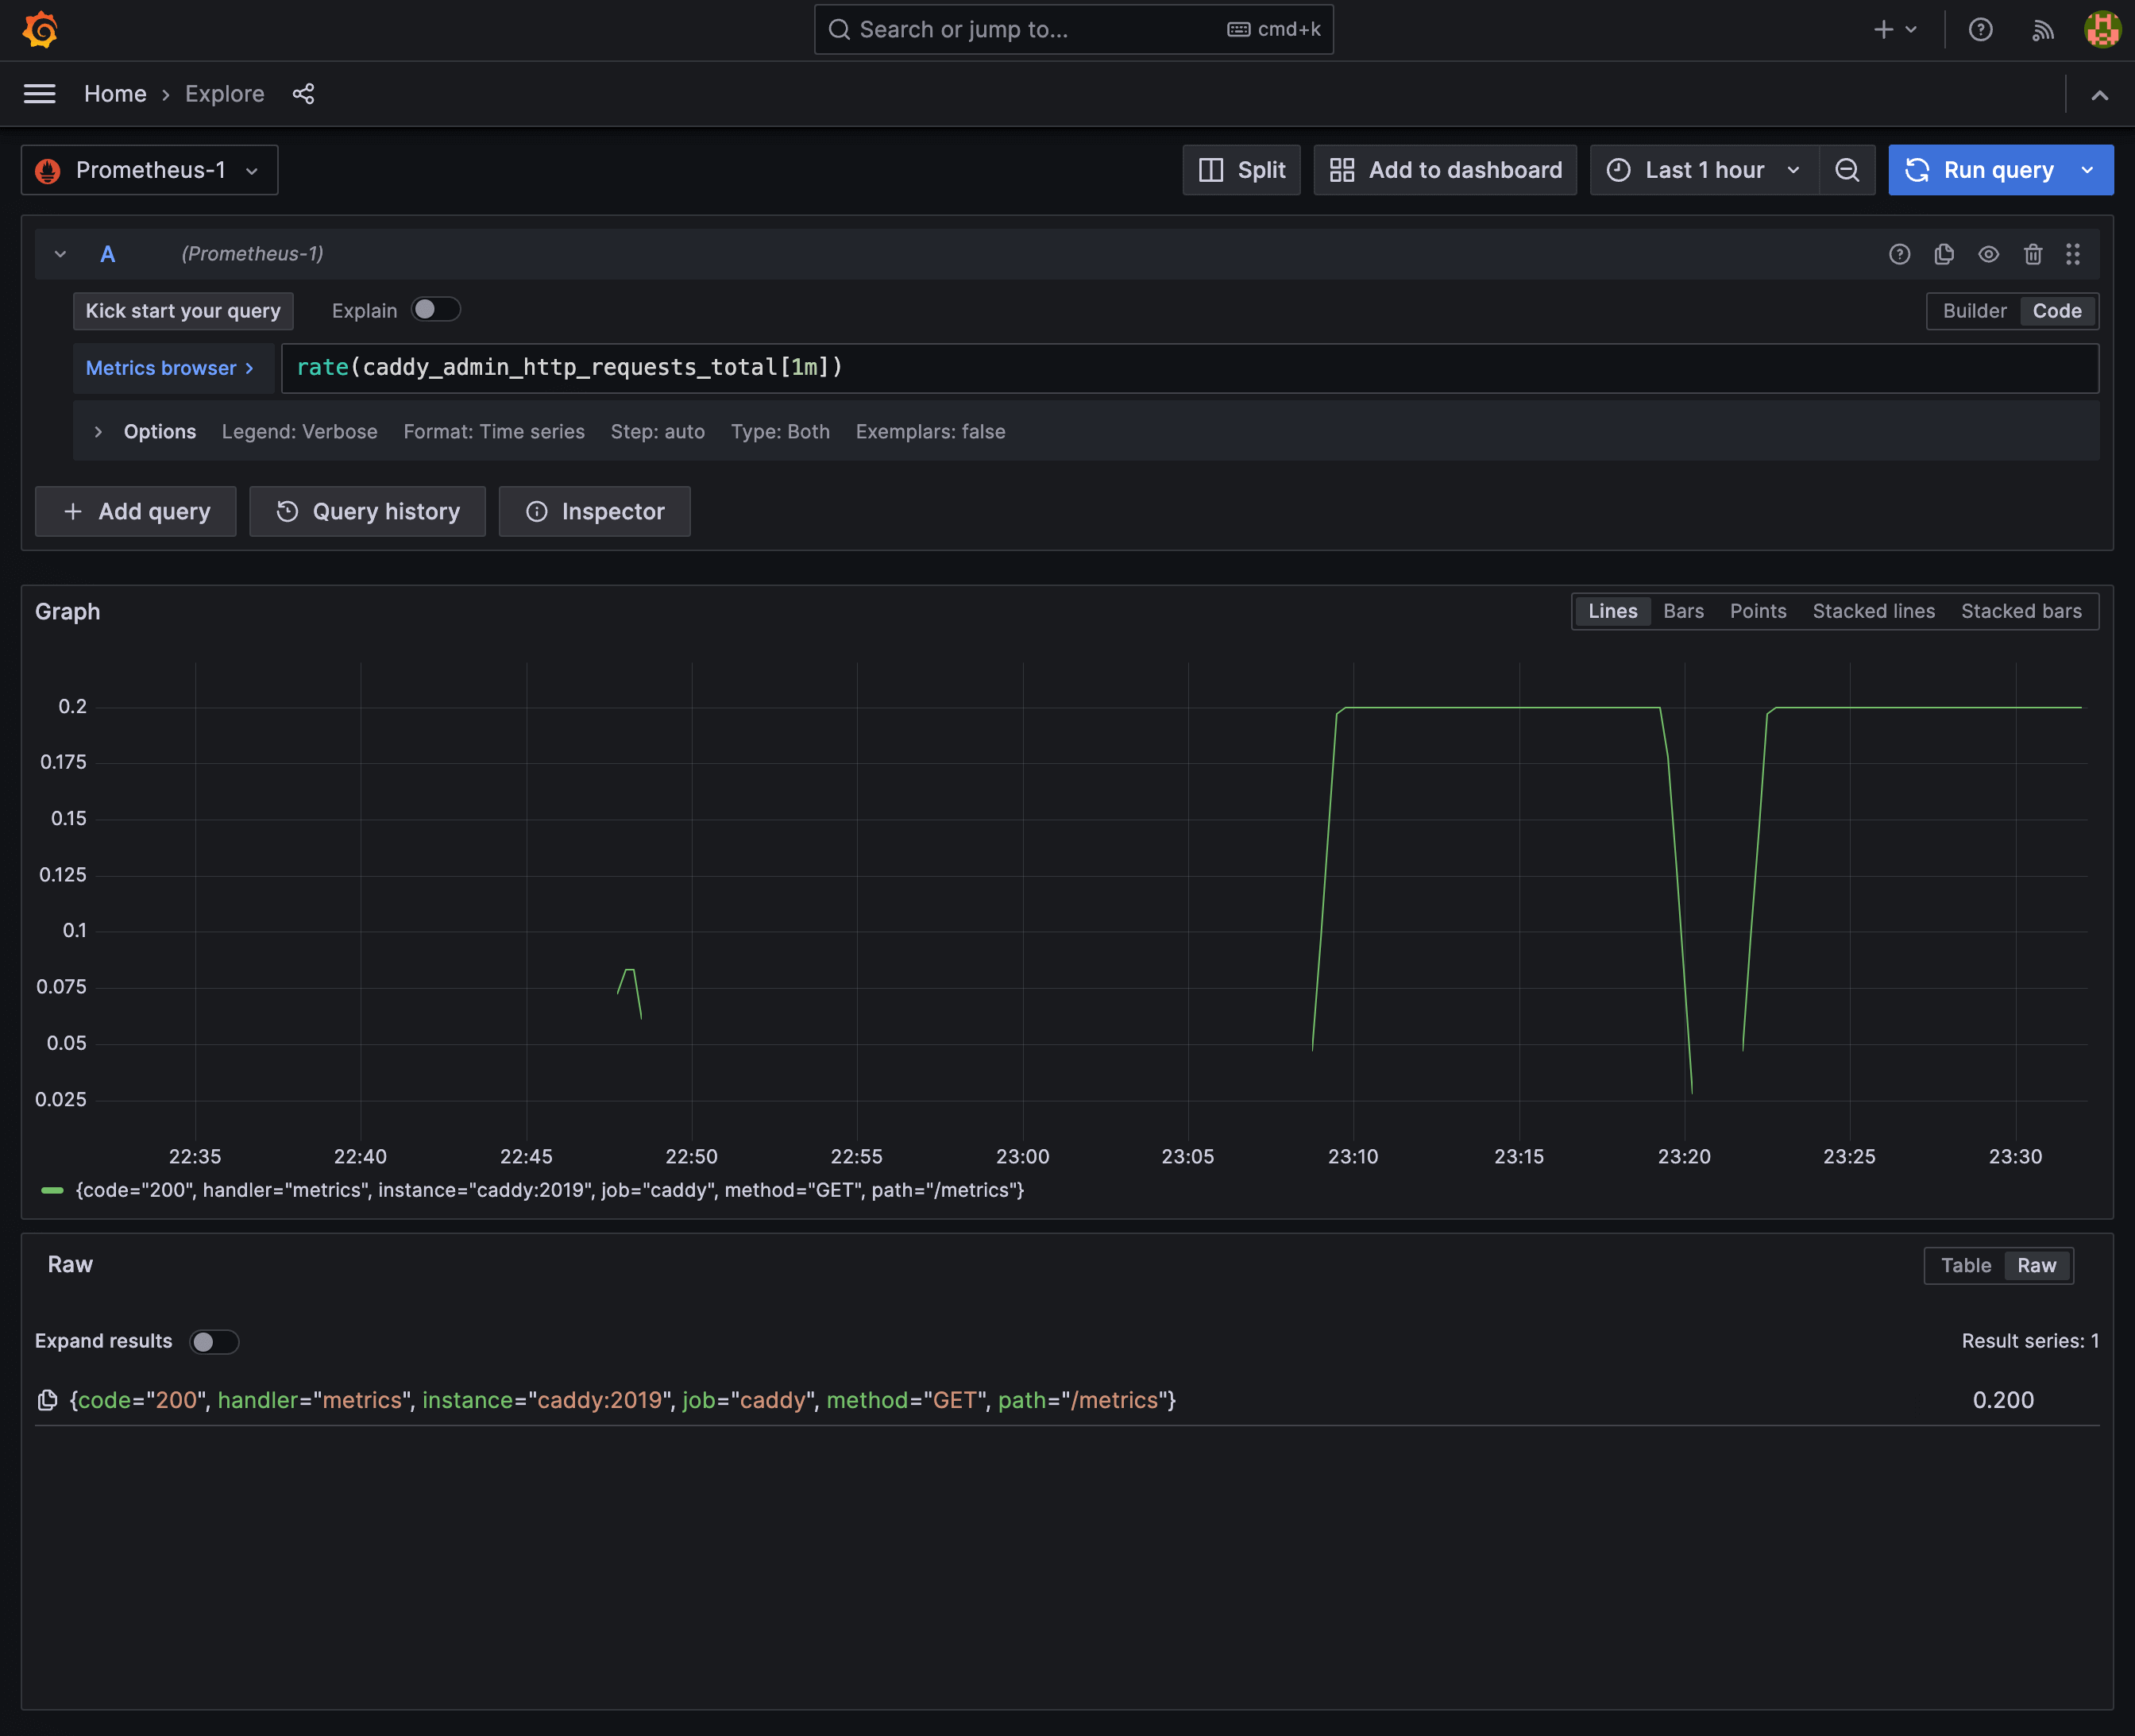
Prometheus should start collecting metrics. Open localhost:9090 and type in a prometheus query.
rate(caddy_admin_http_requests_total[1m])
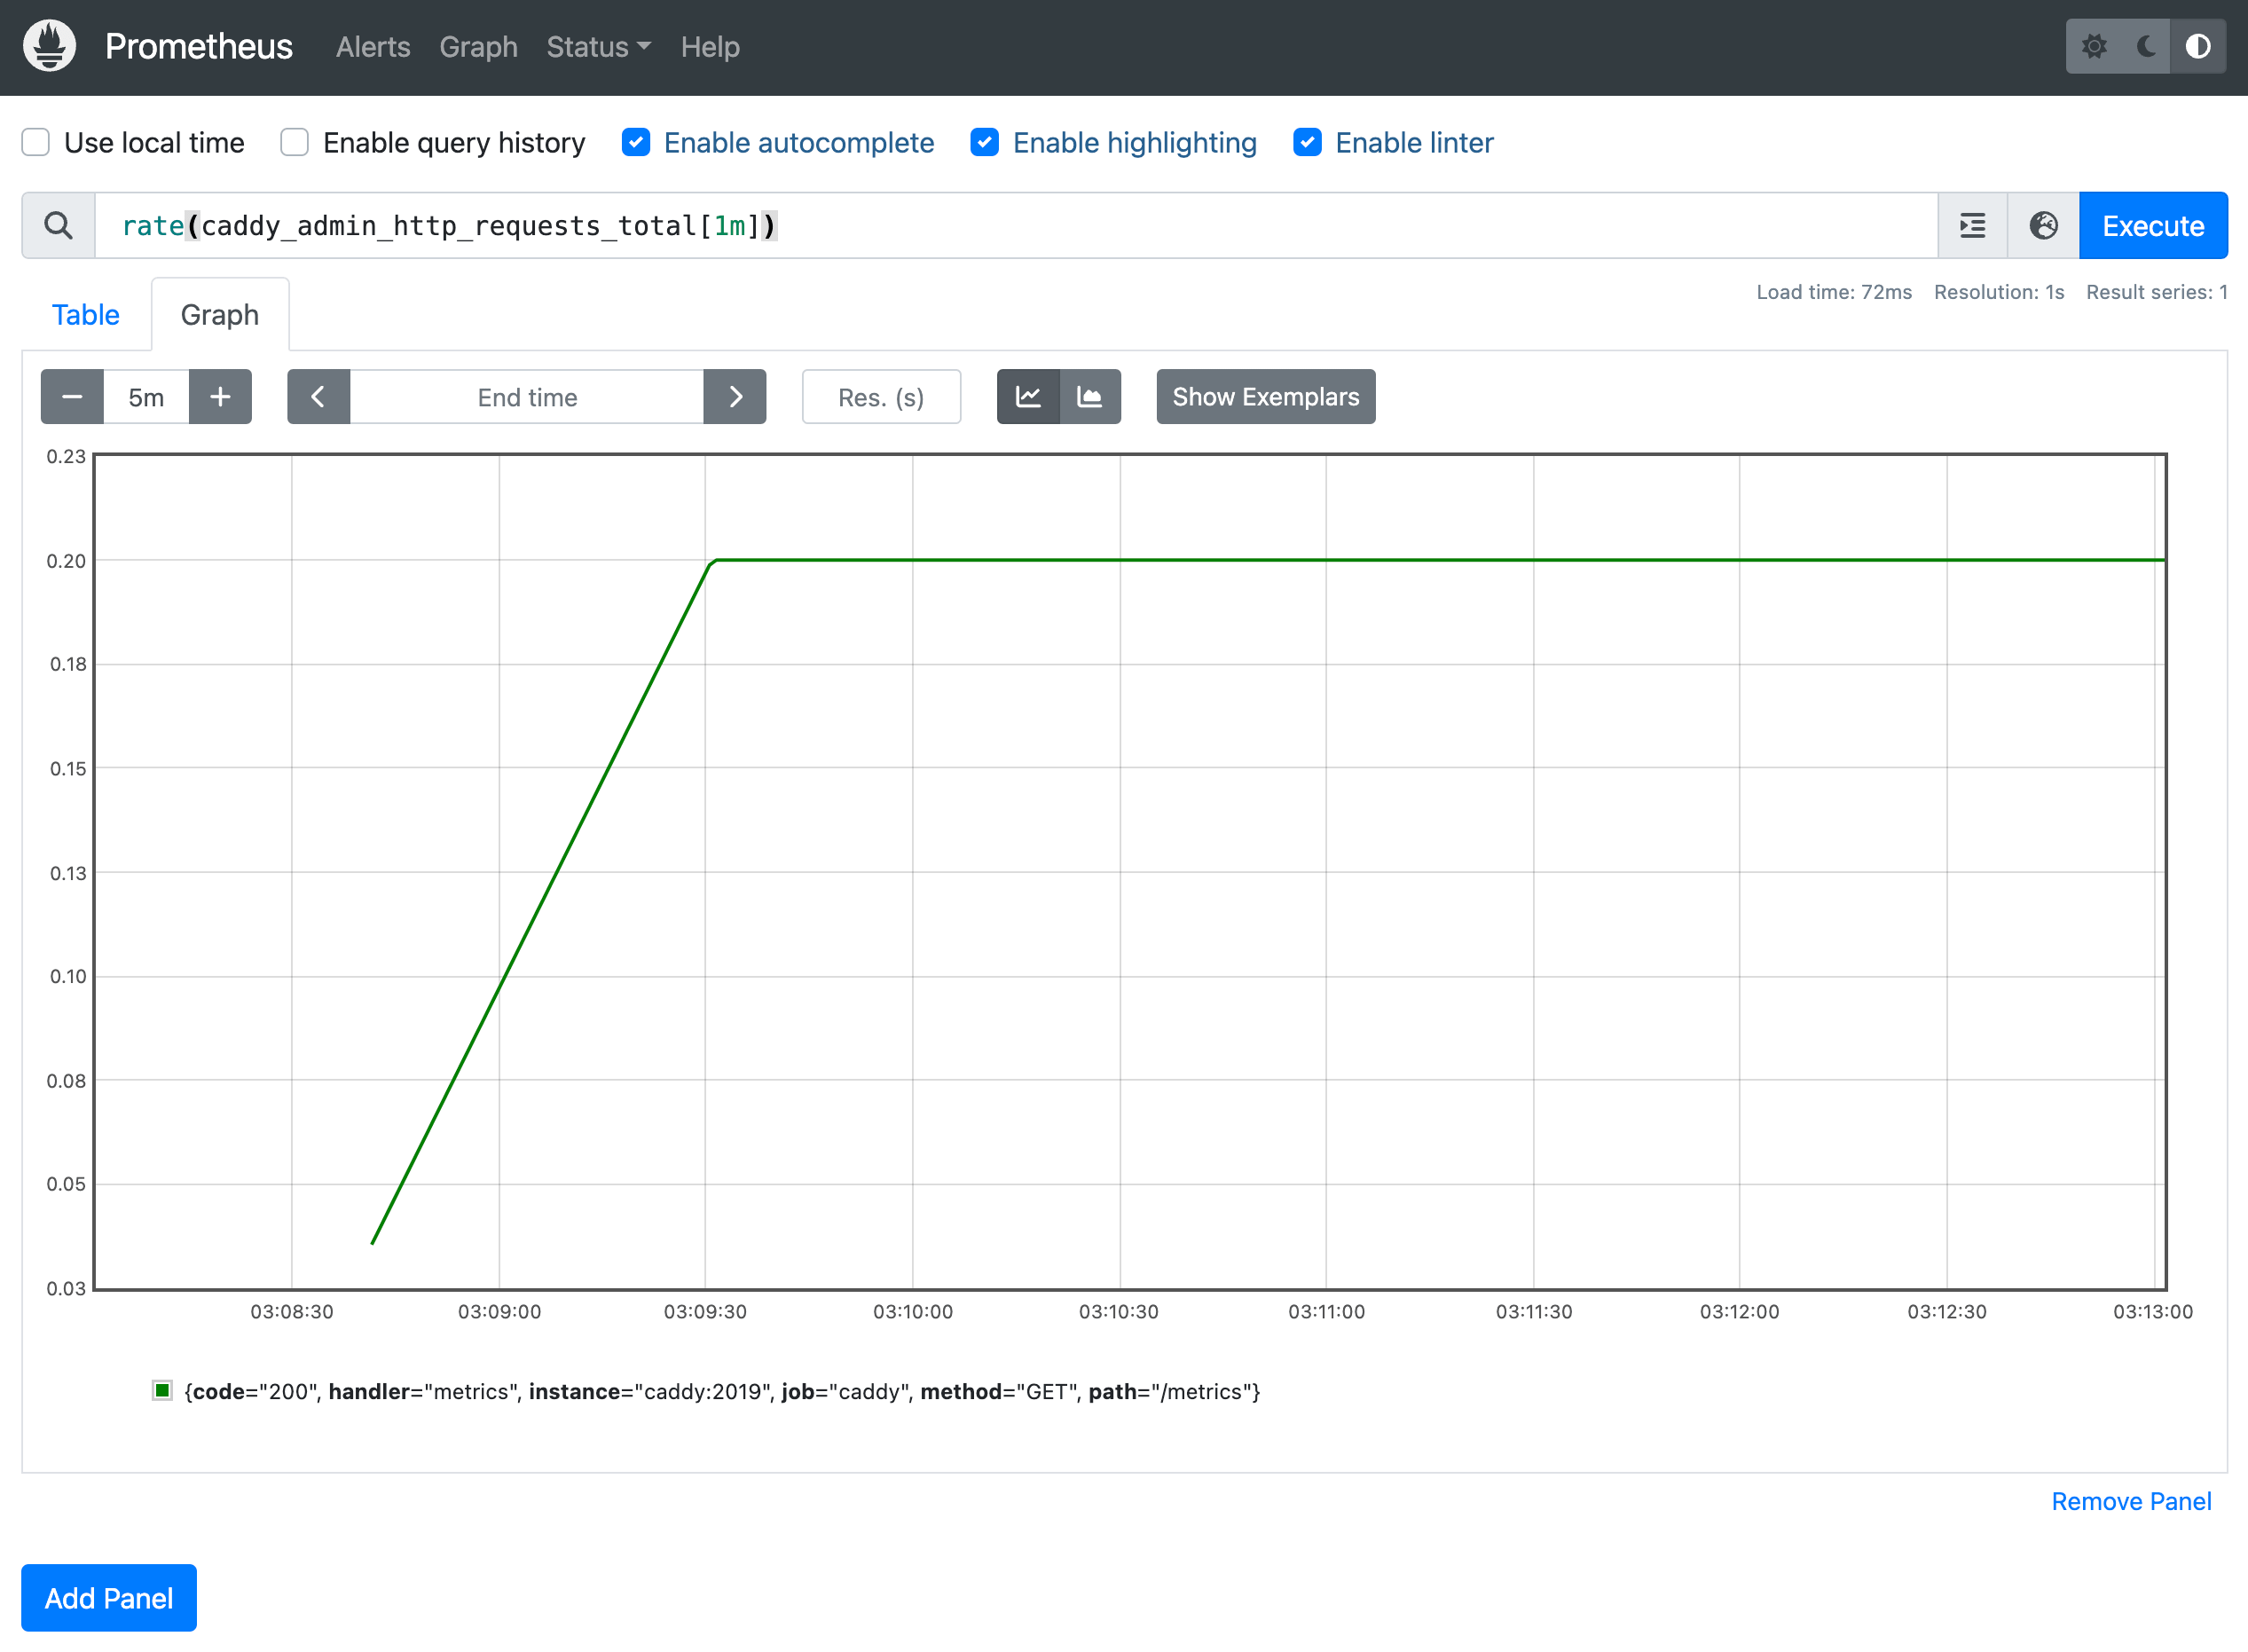
Now you can go ham with the queries!